コード
library(tidyverse)
library(readxl)
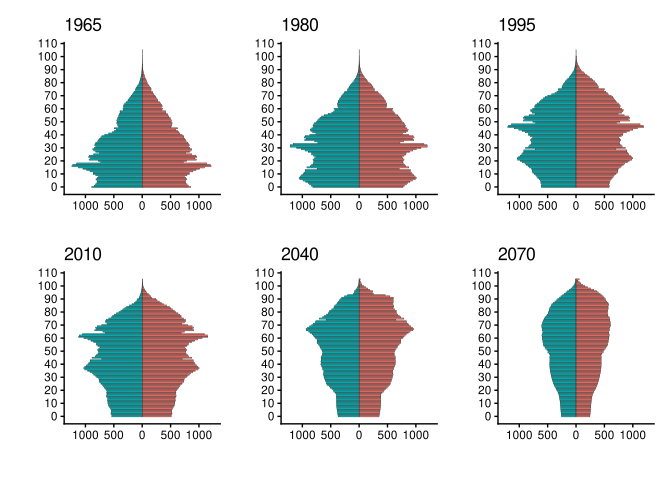
library(patchwork)人口プラミッドの長期にわたる推移と今後の予測を描く。人口ピラミッドの作り方については,人口ピラミッドの作成を参照。
データは国立社会保障・人口問題研究所のホームページからダウンロードする。以前は,過去のデータ,将来の予測が1つのExcelファイルで提供されていて扱いやすかったが,現在は過去のデータと将来の予測が別ファイルで提供されており,データを読み込むのがやや煩雑。将来予測は,出生と死亡のそれぞれが上位,中位,下位の3つの推定に基づくデータが提供されている。
library(tidyverse)
library(readxl)
library(patchwork)dir.create("files", showWarnings = FALSE)
# 国立社会保障・人口問題研究所のホームページから人口ピラミッドのデータをダウンロード
# 以前は国勢調査のデータと将来予測が同じファイルになっていたが,現在は別ファイル。
# 予測人口は,出生中位,死亡中位のデータを用いる。
URL_HIST <- "https://www.ipss.go.jp/site-ad/TopPageData/pyramidDataPP2023J_n.xlsx"
URL_PROJ <- "https://www.ipss.go.jp/pp-zenkoku/j/zenkoku2023/db_zenkoku2023/s_tables/1-9.xlsx"
PATH_HIST <- "files/pyramidDataPP2023J_n.xlsx"
PATH_PROJ <- "files/1-9.xlsx"
# 1960~2020年(国勢調査ベース)
download.file(URL_HIST, destfile = PATH_HIST, method = "curl", quiet = TRUE)
# 2020~2070年(将来推計)出生中位,死亡中位
download.file(URL_PROJ, destfile = PATH_PROJ, method = "curl", quiet = TRUE)
parse_age <- function(x) {
x <- str_trim(as.character(x))
if_else(str_detect(x, "\\+$"), 105L, as.integer(str_extract(x, "^[0-9]+")))
}
tidy_pyramid <- function(path) {
read_sex <- function(sheet, sex) {
yrs <- read_excel(path, sheet, range = "B3:N3", col_names = FALSE) |>
as.integer()
age <- read_excel(path, sheet, range = "A5:A110", col_names = FALSE)[[1]]
read_excel(path, sheet, range = "B5:N110", col_names = FALSE) |>
set_names(yrs) |>
mutate(age = parse_age(age)) |>
pivot_longer(
-age,
names_to = "year",
values_to = "pop",
names_transform = as.integer
) |>
mutate(sex = sex) |>
select(year, age, sex, pop)
}
map2_dfr(c("M", "F"), c("male", "female"), read_sex)
}
read_block <- function(path, sheet, range) {
read_excel(path, sheet, range, col_names = FALSE) |>
set_names(c("age", "total", "male", "female")) |>
mutate(age = as.character(age))
}
tidy_projection <- function(path, sheet) {
meta <- read_excel(path, sheet, range = "A2:A2", col_names = FALSE)[[1]]
year <- as.integer(str_extract(meta, "(?<=\\()\\d{4}(?=\\))"))
bind_rows(
read_block(path, sheet, "A5:D59"),
read_block(path, sheet, "F5:I55")
) |>
filter(!is.na(age)) |>
mutate(year = year, age = parse_age(age)) |>
select(year, age, male, female) |>
pivot_longer(c(male, female), names_to = "sex", values_to = "pop")
}
population <- bind_rows(
tidy_pyramid(PATH_HIST) |> filter(year < 2020),
map(excel_sheets(PATH_PROJ), \(s) tidy_projection(PATH_PROJ, s)) |>
list_rbind()
) |>
arrange(year, sex, age) |>
mutate(pop = if_else(sex == "male", -pop, pop))# 人口ピラミッドを作成する年を指定
years <- c(1965, 1980, 1995, 2010, 2040, 2070)
for (i in years) {
fig <- population |>
filter(year == i) |>
ggplot(aes(x = age, y = pop, fill = sex)) +
geom_bar(stat = "identity", color = "black", linewidth = 0.1) +
scale_x_continuous(n.breaks = 10) +
scale_y_continuous(
limits = c(-1250, 1250),
breaks = seq(-1000, 1000, 500),
labels = abs(seq(-1000, 1000, 500))
) +
scale_fill_hue(
name = "",
labels = c("F" = "女", "M" = "男")
) +
labs(title = i, y = "", x = "") +
coord_flip() +
theme_classic() +
theme(legend.position = "none")
if (i == years[1]) {
g <- fig
} else {
g <- g + fig
}
}
plot(g)